BUSINESS SITUATION
- A leading US-based private equity firm faced fragmented, inefficient reporting for their private debt fund. Manual data processes caused delays, inaccuracies, and poor visibility
- They needed a robust solution to streamline reporting, enhance accuracy, and provide real-time insights.
ENGAGEMENT
Development and Implementation of a Power BI Dashboard for Debt Fund Performance Monitoring and Reporting
SGA APPROACH
- Assessment and requirement gathering: Conducted thorough discussions with key stakeholders to understand specific reporting needs and pain points. Reviewed existing data sources, including internal databases, financial systems, and third-party data providers
- Data Integration and preparation: Integrated diverse data sources into a centralized data warehouse to ensure a single source of truth. Cleaned and transformed data to ensure consistency and accuracy across various metrics.
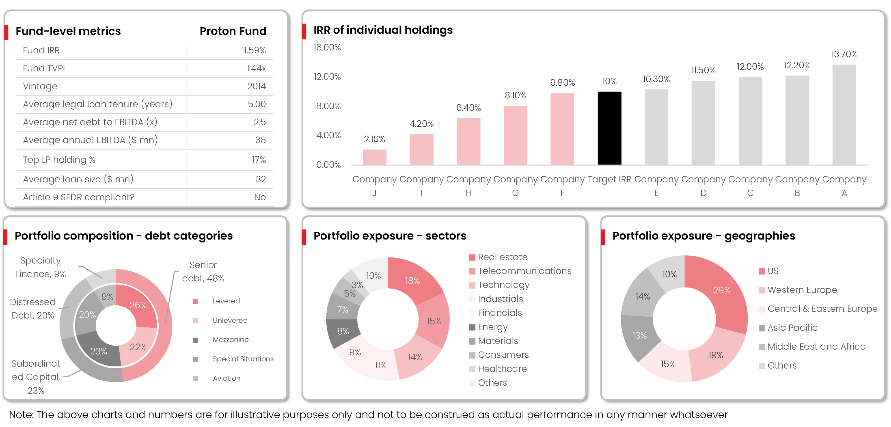
- Dashboard design and development: Designed intuitive and interactive Power BI dashboards tailored to the firm’s specific requirements. Developed key performance indicators (KPIs) and metrics that provide comprehensive insights into fund performance, risk metrics, and portfolio composition.
- Testing and validation: Conducted rigorous testing to ensure data accuracy, dashboard functionality, and user accessibility. Incorporated feedback from stakeholders to refine and enhance the dashboards.
- Training and support: Provided training sessions to ensure the client’s team could effectively use interpret the dashboards. Offered ongoing support to address any issues and implement updates as needed
Insightful dashboards for performance reporting of a private debt fund

Click on the image to view enlarged
BENEFITS & OUTCOME
- Insightful interfaces: SG Analytics provided intuitive visualizations and user-friendly interfaces that enhanced stakeholder engagement and understanding of key metrics
- Adaptive reporting: Developed a scalable and flexible solution to ensures that reporting tools can adapt to evolving business needs and data complexities
KEY TAKEAWAYS
- Automated data integration and processing reduced manual errors and ensured accurate reporting
- Streamlined reporting processes significantly reduced the time and effort required to generate performance reports

