BUSINESS SITUATION
A global PE firm wanted to track Accounts Payable (AP) & Accounts Receivable (AR) closely to reduce outstanding days due to increased interest rates
ENGAGEMENT
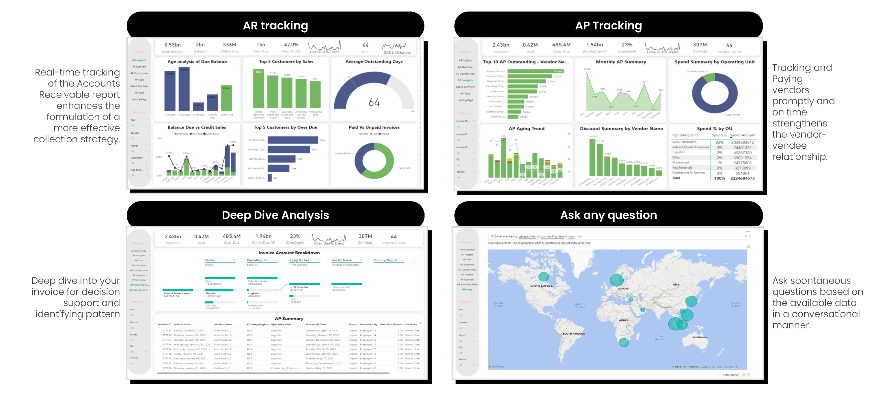
We created AP and AR database with 20+ KPIs and developed dynamic and interactive dashboards to optimize cash cycles.
SGA APPROACH
- Data collection: Integrated and aggregated AP and AR data from client’s ERP systems and excel/CSV files
- Data processing: Generated 20+ KPIs (outstanding days, payments overdue, etc.) to assess current situation
- Dashboard development: Designed and built dedicated dashboards catering to the AP and AR teams with dynamic linkage of the database leveraging business intelligence tools
- Data visualization: Embedded tree charts for better decision support and pattern identification
- Interactive insights: Enabled report with natural language processing functionality to answer ad hoc questions
Our dashboards helped our client derive actionable insights to improve visibility of cash flow
Click on the image to view enlarged
BENEFITS & OUTCOME
- Efficiency: Saved ~4000 manual hours annually through effective data management and dynamic dashboards
- Enhanced business impact: Dashboard provided insights for strategic adjustments, enhancing liquidity management and vendor payment timeliness
KEY TAKEAWAYS
- Created daily dashboard for AP & AR teams, boosting operational focus and efficiency
- Strengthened controls within the AP & AR process resulting in better liquidity management and enhanced vendor and customer relationships