Data visualization is essential in today’s business environment because it enables organizations to make better decisions when the information is visually appealing. Power BI and Tableau rank highly among the tools. Both possess their advantages and disadvantages and suit different business requirements. In this article, a comparative analysis of Power BI and Tableau, their optimal utilization will be made, and recommendations on the appropriate tool to be utilized in the business will be offered.
Power BI vs. Tableau: An Overview
Almost every business uses one or more tools for virtual data presentation, and Power BI and Tableau fall within this category of powerful tools. There are differences in the scope of usage, functionality, ease of use, and target users.
Power BI
Power BI is amongst the most used business applications in terms of analytical capabilities, as it enables business users to author reports and dashboards based on active data visualization and business intelligence tools. It is a cloud-based business analytic tool developed by Microsoft. It is intuitive to use and integrates well with other Microsoft products; hence, it is widely adopted in the Microsoft ecosystem.
Tableau
Tableau, one of the most used data visualization systems, is known mainly for its capacity to manage massive amounts of data and easily employ elaborate graphics. Its simple and versatile design makes it popular among data scientists and analysts who are expected to conduct extensive data analyses.
Read more: The Best 10 Data Visualization Tools in 2024
Comparing Power BI and Tableau
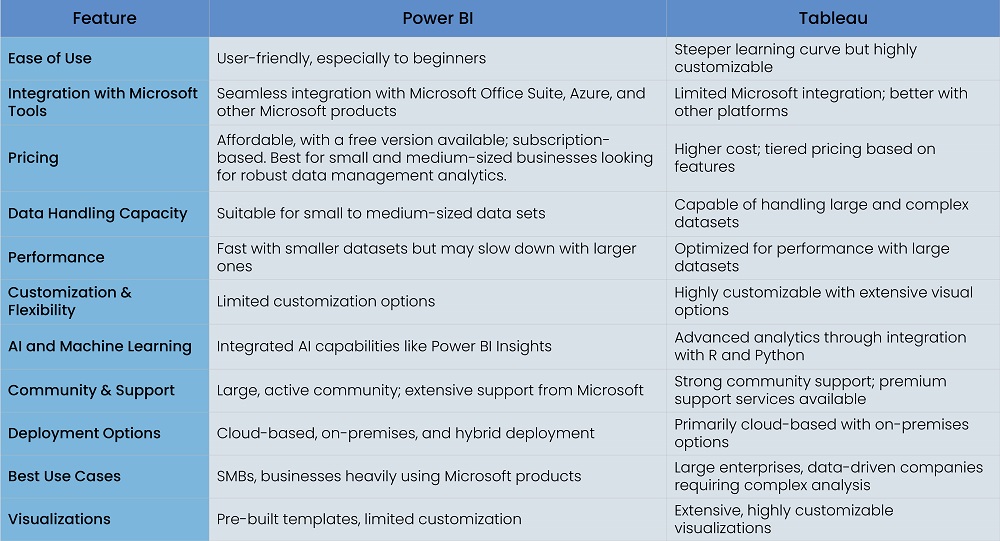
Here is a detailed comparison of Power BI and Tableau.

Best Use Cases for Power BI
Features of Power BI have enhanced the ability to capture-oriented situations, particularly for heavy users of Microsoft software, and require simple data analytics. Some of the business scenarios in which Microsoft Power B1 has emerged as the safest inceptor include:
Microsoft Centric Environments
- Seamless Integration: Power can be integrated well with other applications within Excel, SharePoint, and Azure, and thereby, it is a good option for those companies that fall within Microsoft. Microsoft Power BI services enhance these integrations by providing advanced connectivity and collaboration features.
- Microsoft Teams and Office 365: Users of Microsoft Teams or Office150 organizations may consider using Power BI to empower data visualization by integrating the application with its reports into collaborative tools.
Small to Medium Business (SMBs)
- Cost-Effective Solution: Power BI is inexpensive and has many potentials, including a free version. This is how the tool appeals to small and medium businesses with low data analytics budgets.
- Scalable to Growing Needs: Business intelligence can grow with firms expanding power. In more cases, power intelligence growth potential is built and requires no major infrastructure changes.
Read more: Why Data Visualization is Crucial for Modern-day Businesses?
Rapid Dashboard and Report Creation
- Pre-built templates: With multiple easy-to-use pre-built templates and visualizations of the Power BI, a user can track and gather reports and dashboards with minimal customizations.
- Easy User Interface: A drag-and-drop method and a simple design make it possible for even non-technical people to develop great reports and dashboards.
Data-Based Management in Marketing and Sales
- Sales and marketing analytics: Power BI can provide deep insights regarding customers, their sales, and marketing performance due to its ability to connect with CRMs, social media, and other marketing platforms.
- Predictive analytics: AI and other machine learning resources create an environment where a business can predict future models, recognize key areas for improvement, and, based on data, suggest ideas to enhance the sales and marketing department further.
Analysis of Data on a Real-time Basis
- Live data streaming: Power BI allows users to stream live data, thus making it ideal for organizations interested in tracking real-time performance and financial or customer interaction levels, among other metrics.
- Real-Time Changes: In views and reports, changes in the data automatically refresh and update so that the people making decisions always use the current and most accurate details.
Business Intelligence for Non-Technical Users
- Self-Service Business Intelligence: Power BI software encourages self-service business intelligence as end-users who need to gain technical knowledge are capable of data analysis, reporting, and sharing insights without the aid of the IT department.
- Natural Language Queries: Including Q&A in Power BI enables users to type in questions, which the business tool uses to formulate visual representations of the data. Business intelligence becomes everyone’s business regardless of their technical expertise.

Best Use Cases for Tableau
With efficient and flexible data management and visualization, Tableau features are famous for being convenient for organizations with advanced analytics and focused visuals. Below are some Tableau use cases:
Big Companies and Analytics-Oriented Companies
- Dealing with Complicated and Extensive Data Sets: It is often difficult for large organizations to maintain an increasing amount of data. Such functions exist; they manage large volumes of data to be processed quickly, which suits such complex organizations.
- Cross-Functional Analysis of Data: Since Tableau can work with many data sources, including big data, it is possible to implement cross-functional data analytics across several departments in the organization.
Situations Requiring High-End Data Visualization Services
- Highly Customizable Visualizations: Users can analyze the data in more detail than with simple tools, as Tableau can create highly sophisticated and customizable visualizations.
- Storytelling with Data: Tableau renders that feature of users being able to make a story timely to the users with the statistics, making decision-making even easier for the stakeholders.
Industries Requiring In-depth Analysis
- Financial Services: In the financial services sector sector, Tableau is the most popular application for conducting market research, trend analysis, risk analysis analysis, and performance appraisal. In addition, it is highly useful in this industry since it supports difficult calculations and huge volumes of data.
- Healthcare: The healthcare sector leverages Tableau’s analytical capabilities of patient information to enhance healthcare services, improve internal work processes, and assess the results.
- Retail and E-commerce: Tableau is aimed at customer analytics, supply chain, and sales performance management for retail and e-commerce brands.
Data Science and Machine Learning Integration
- Integration with R and Python: With the R and Python integration within Tableau, data scientists can carry out analytics and machine learning all in one place, which is appropriate for businesses that need advanced analytics. Power BI consulting services often highlight the benefits of combining Tableau’s capabilities with sophisticated data science techniques for comprehensive business insights.
- Predictive Analytics: With the Tableau application, there are options for adding predictive analytics capabilities to the dashboard, making it possible for the company to do trend analysis and planning.
Collaboration Across Teams
- Shared Insights: Thanks to Tableau’s collaboration tools, viz. Tableau Server, Tableau Online, etc., all reports and dashboards can be disseminated across the teams, further entrenching a culture of data within the organization.
- Data Governance through Centralization: Using Tableau, organizations can make good use of data governance tools, assuring that data remains authoritative, credible, and available for authorized users.
Custom Reporting and Dashboarding
- Custom Dashboards: Tableau's flexibility permits individuals to develop custom dashboards that capture the business information needed from the C-level management to the level of operations.
- Data Refreshing in Real Time: The nature of Tableau also permits back-end connectivity to other systems in real time. This makes it appropriate for organizations that require constantly updated information and fast decision-making based on the data.
Education and Training
- Learning and Development: An academic application of Tableau for analytics and data visualization training. This is due to its being task-oriented with advanced features; the student will move towards being an assigned data professional.
- Certification Programs: Users who want to validate their expertise with the help of Tableau’s certification programs represent the most prominent audience among those seeking improvement in job positions related to data analytics.
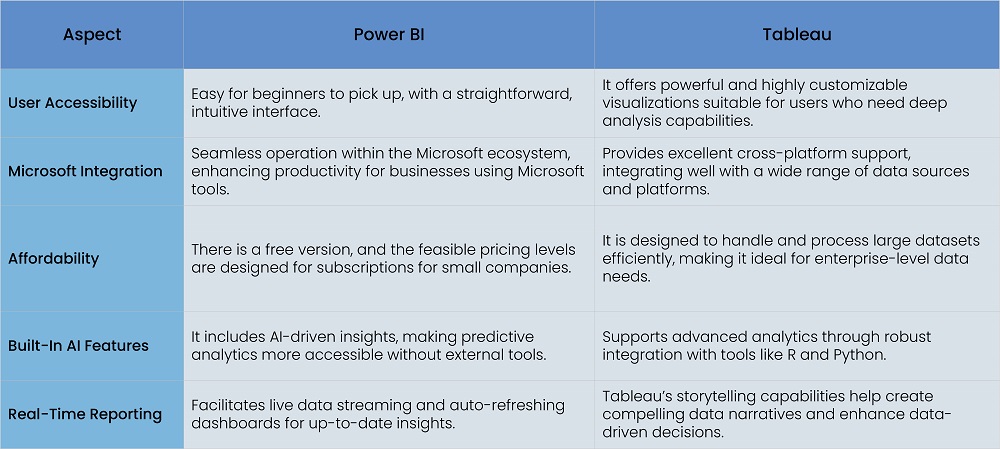
Pros of Tableau and Power BI
Mentioned below are the pros of Tableau and Power BI.

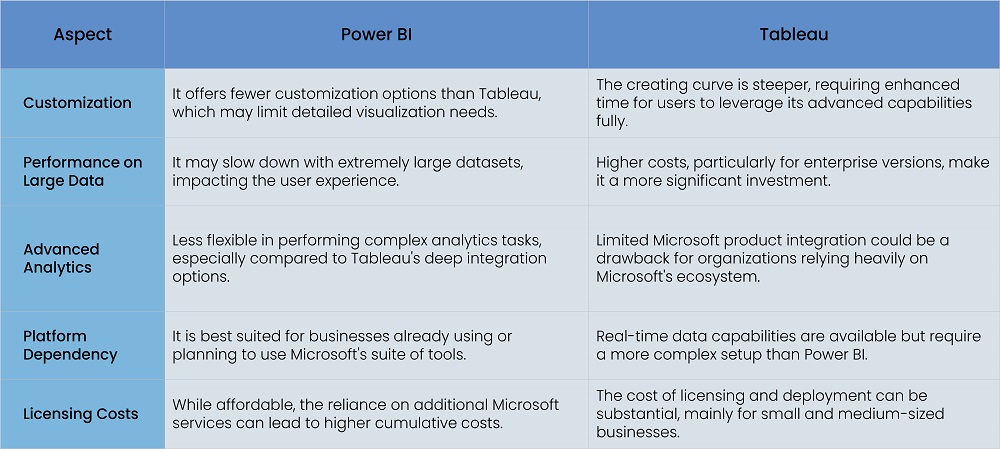
Cons of Power BI and Tableau
Mentioned below are the cons of Tableau and Power BI.

Read more: Beyond Numbers: Unveiling the Power of Data with Visualization
Conclusion: Choosing the Right Tool for Your Business
Understanding Power BI and Tableau differences and when to select Power BI or Tableau mainly depends on the size of the organization, its requirements, and the technology it uses. Suppose an organziations is part of the Microsoft community and is searching for a cost-effective solution and straightforward tools for data management and visualization only. In that case, Power BI will suit them best. Many businesses also prefer the service because of the pricing and the availability of Power BI consulting. However, if an organization is looking for quality data visualization, handling huge and various datasets, and is ready to spend money on the best tool, Tableau will be a better option. Its products are appealing as they are powerful and flexible enough to meet the needs of businesses that rely on extensive and intricate data analysis. Nevertheless, both tools have compelling attributes that can help an organization’s data presentation and business intelligence tableau to the next level. The main thing is to evaluate the appropriate platform that fits the organization's objectives.
A leading enterprise in Data Analytics, SG Analytics focuses on leveraging data management solutions, analytics, and data science to help businesses across industries discover new insights and craft tailored growth strategies. Contact us today to make critical data-driven decisions, prompting accelerated business expansion and breakthrough performance.
About SG Analytics
SG Analytics (SGA) is an industry-leading global data solutions firm providing data-centric research and contextual analytics services to its clients, including Fortune 500 companies, across BFSI, Technology, Media & Entertainment, and Healthcare sectors. Established in 2007, SG Analytics is a Great Place to Work® (GPTW) certified company with a team of over 1200 employees and a presence across the U.S.A., the UK, Switzerland, Poland, and India.
Apart from being recognized by reputed firms such as Gartner, Everest Group, and ISG, SGA has been featured in the elite Deloitte Technology Fast 50 India 2023 and APAC 2024 High Growth Companies by the Financial Times & Statista.


