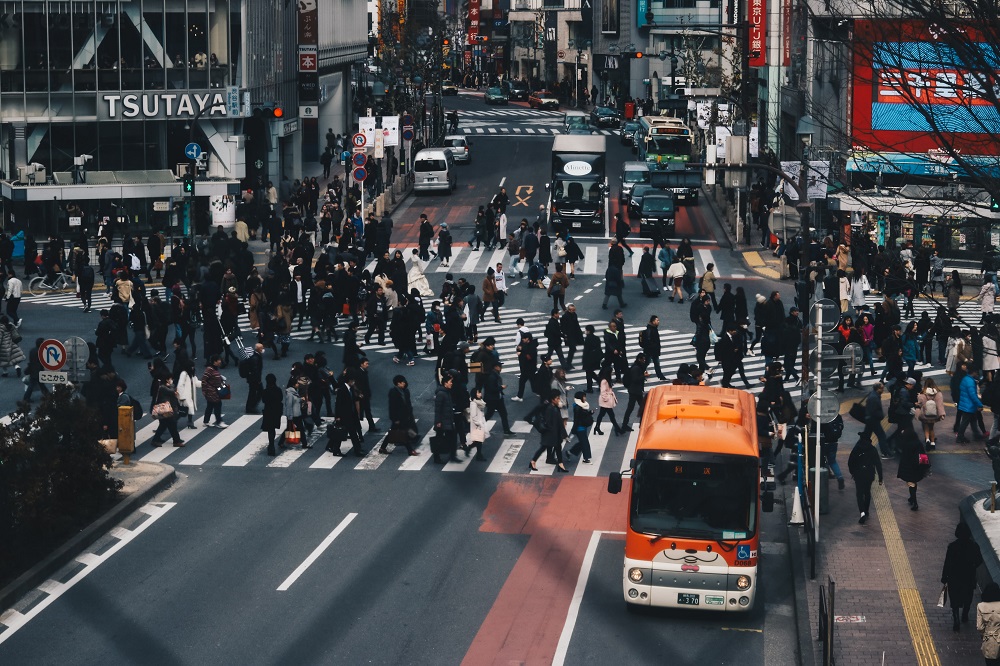
The COVID-19 pandemic changed various aspects of our daily lives. With countries taking ad-hoc measures to restrict the spread of COVID-19, the world was moving at the pace of the pandemic and the rise of its variants. This led to a decline in traffic congestion levels worldwide, per a TomTom Traffic Index report.
Key Highlights:
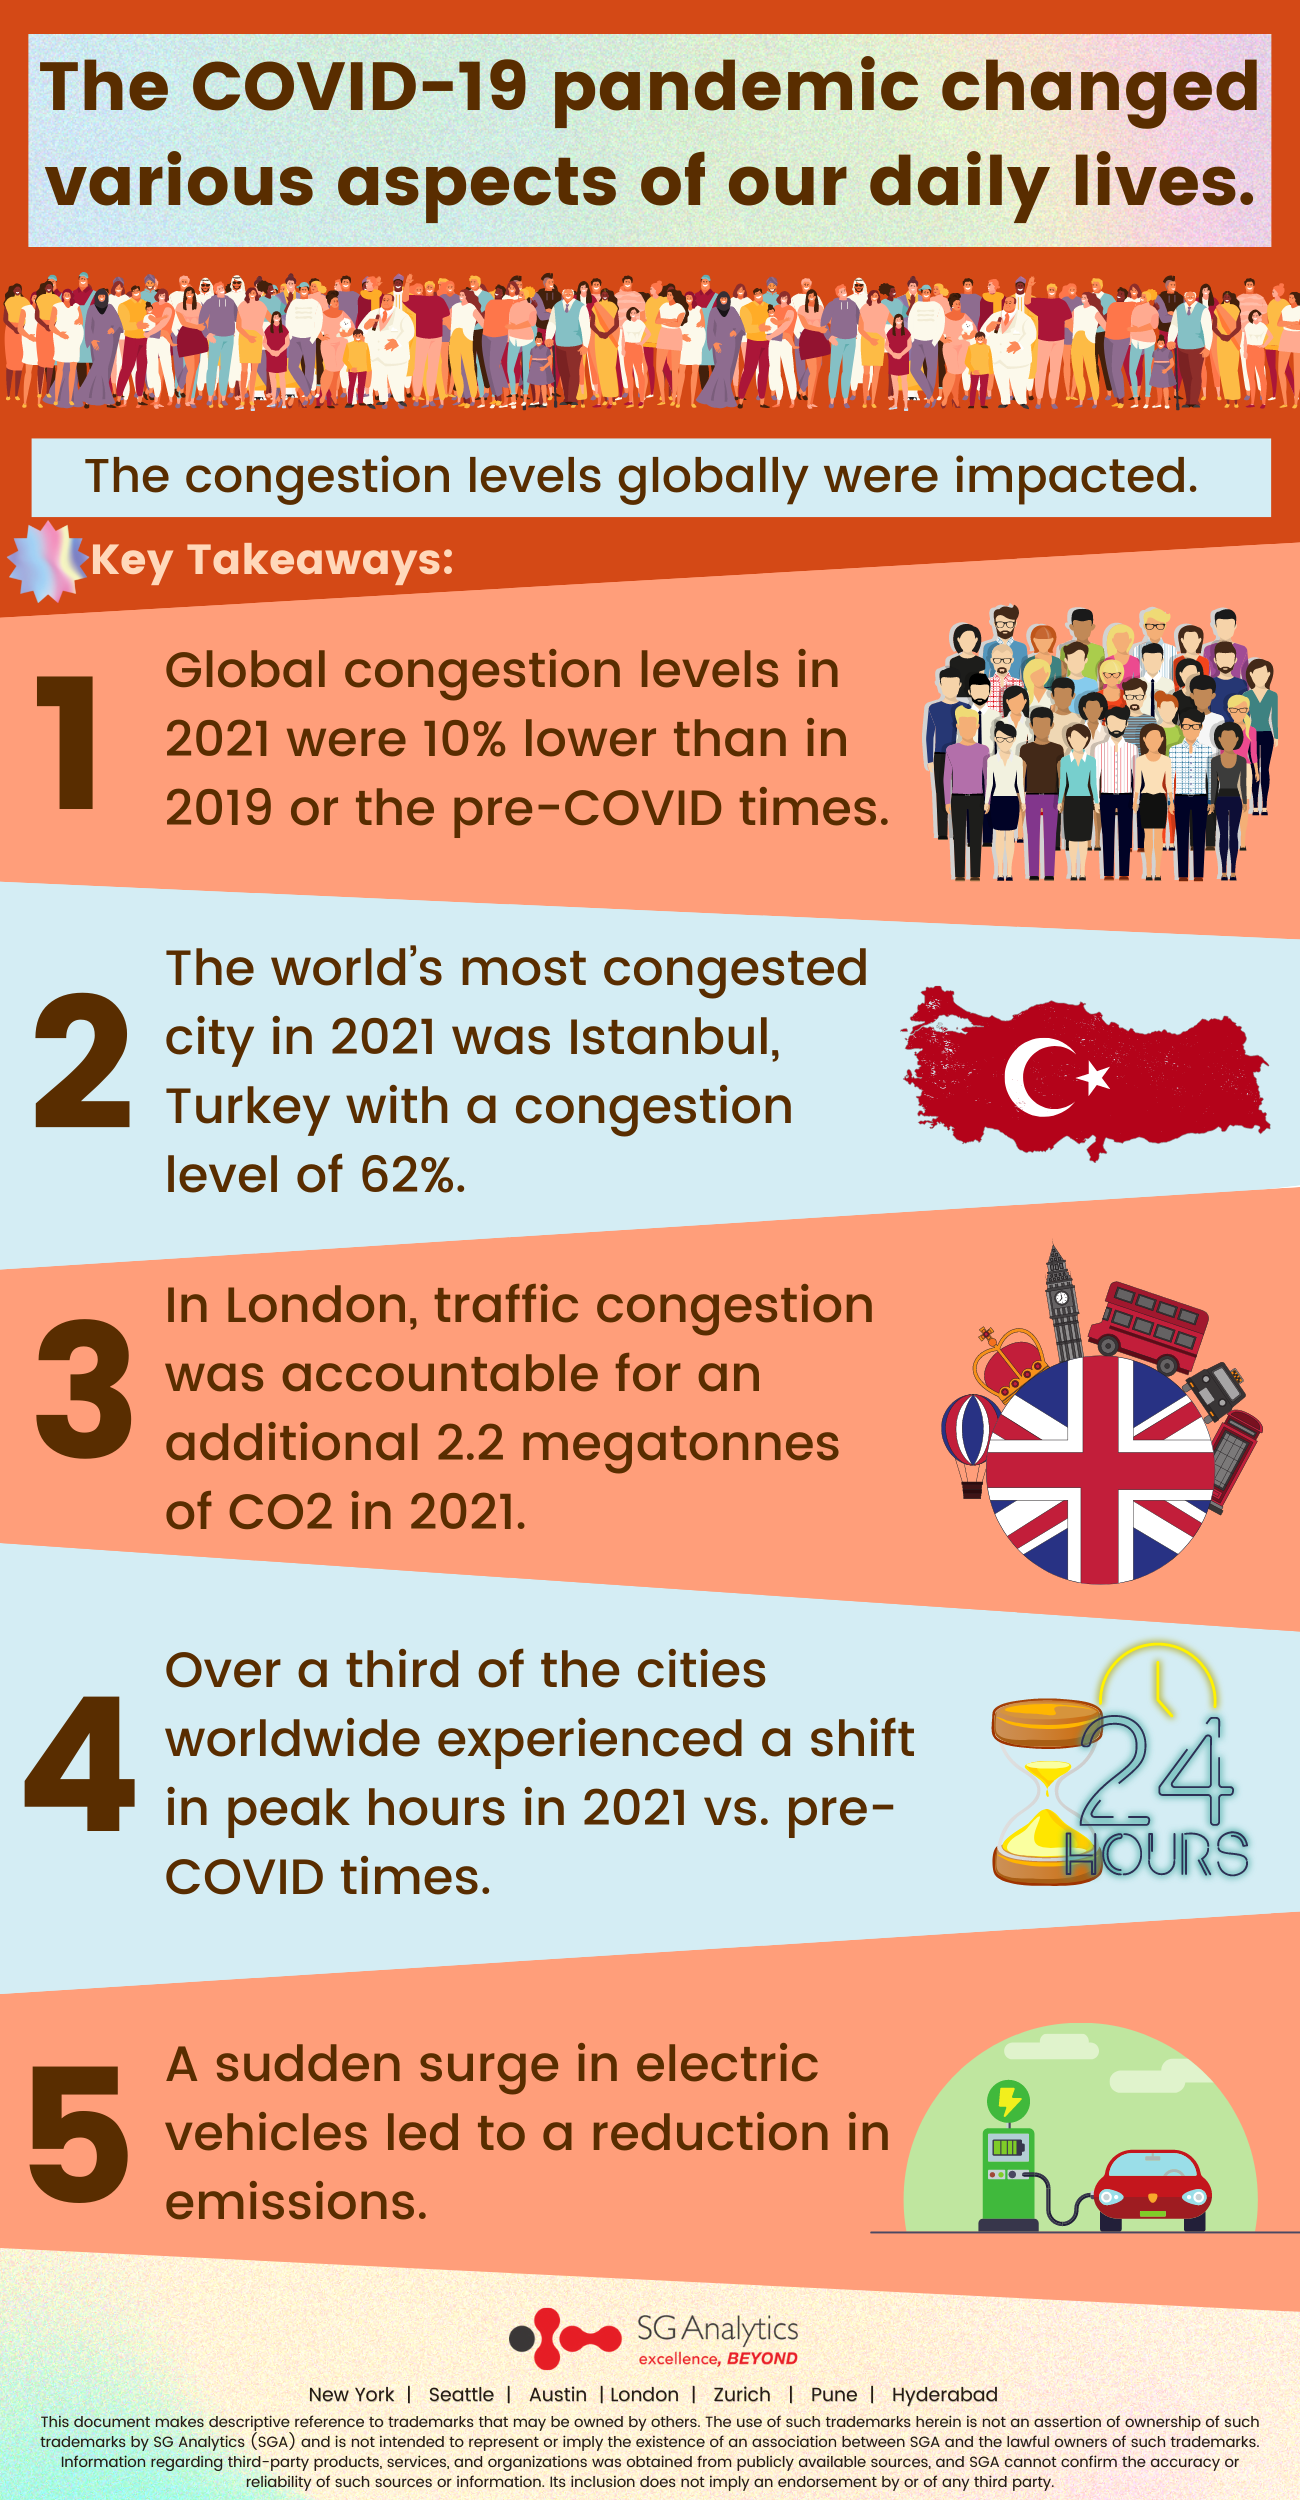
- Global congestion levels in 2021 were 10% lower than in 2019 or pre-COVID.
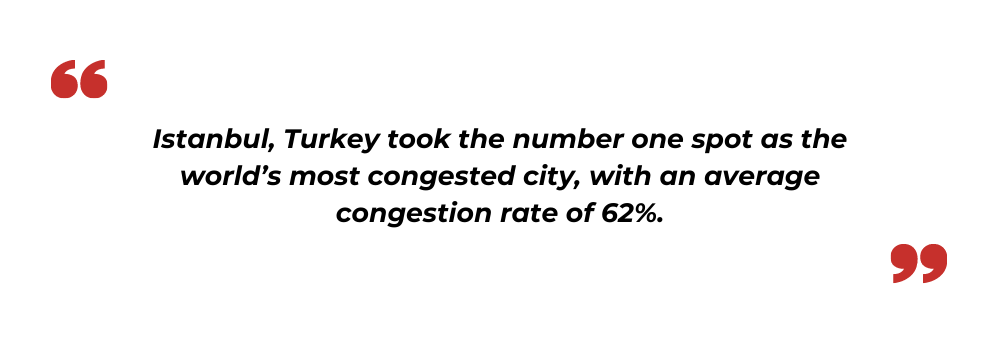
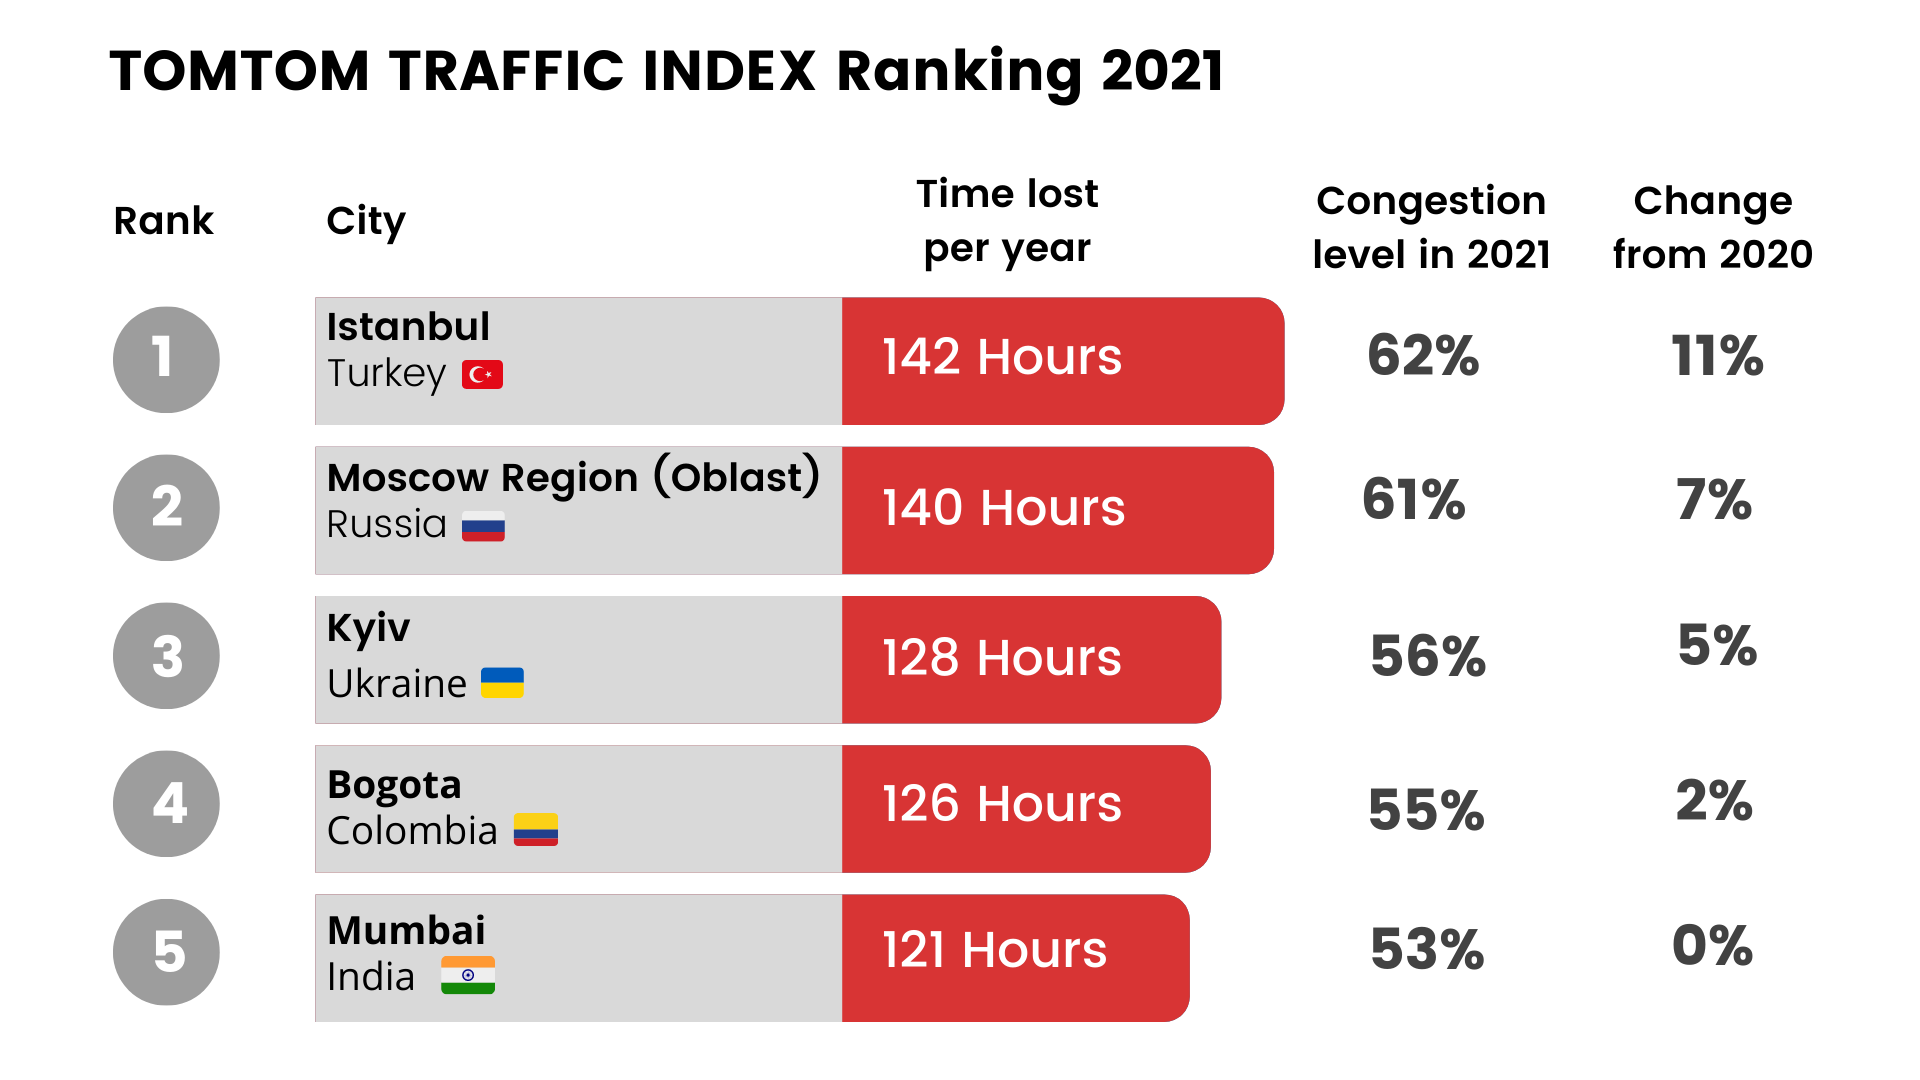
- The world’s most congested city in 2021 was Istanbul, Turkey, with a congestion level of 62%.
- In London, traffic congestion was accountable for an additional 2.2 megatonnes of CO2 in 2021.
- Over a third of the cities worldwide experienced a shift in peak hours in 2021 vs. pre-COVID times.
- A sudden surge in electric vehicles led to a reduction in emissions.
The data collected by TomTom, a navigation technology company, disclosed that traffic congestion in cities globally was 10 percent lower last year than it was in 2019. The new data released offers a deep insight into how the coronavirus has changed our cities. The study reported that the cities experienced less traffic than they did in pre-pandemic times.
The TOMTOM Traffic Index
Covering 404 cities across 58 countries, the Traffic Index ranked urban congestion across the globe and facilitated free access to city-by-city data. The 2021 report includes details of emissions data for 4 European cities. Through the TomTom Traffic Index, the team at TomTom aims to provide aid in creating a safer, cleaner, congestion-free world.
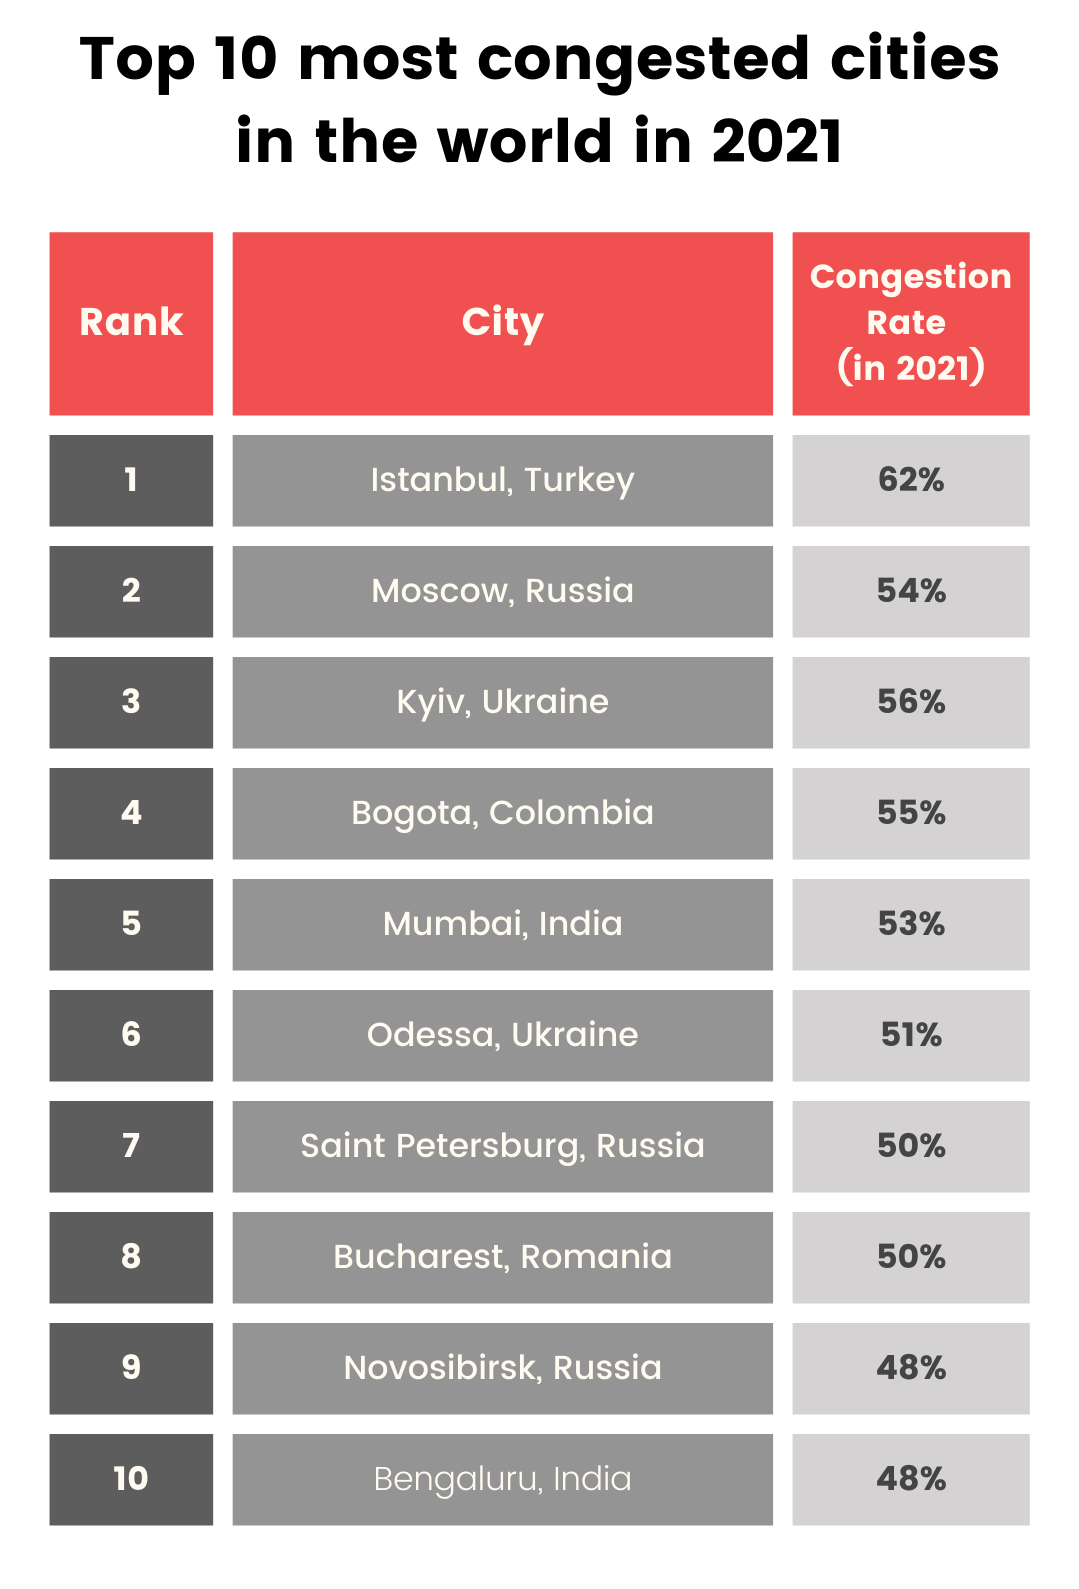
According to the latest TomTom Traffic Index, Istanbul was the most congested city, followed by Moscow in second place. Mumbai was ranked as India’s most congested city in 2021. The study highlighted statistics on urban congestion worldwide. The reports declared Turkey’s Istanbul the world’s most congested city in 2021, with a congestion level of 62%. The TomTom Traffic Index offers detailed insight into the traffic trends in 404 cities throughout 2021.
The data displayed a drop in congestion levels in 2021 when compared with 2019. Let’s take a closer look at the world’s ten most congested cities.
Decoding the data collection
Big data was employed to collect data across different geographies, and the maps were optimized with artificial intelligence and machine learning. The real-time traffic information collected was utilized to understand the congestion patterns.
The traffic witnessed an average decrease of 21% globally in 2020, and congestion was down by 28% during rush hour. While the traffic levels did increase from 2020, they were still not back to pre-pandemic levels. The increase in congestion was due to the massive fluctuation in traffic levels due to cities entering and coming out of lockdown measures.
Despite the COVID lockdown having kept several vehicles off the road globally, the easing restrictions affected congestion in many cities.
However, while micro-mobility supported inner-city mobility, most traffic pain points were due to the interurban movement. But in the context of the pandemic, public transit lost much of its charm as travelers opted for their private cars, as they seemed to be a safer way to restrict the spread of the virus and maintain social distancing.
Mobility options underwent changing rapidly as a part of the adaptable lifestyles triggered due to the pandemic. With the onset of the pandemic, new mobility usages gained popularity. Automobiles like e-scooter and bicycles saw a surge in their usage.
The data revealed that people traveled at different time zones. While some cities noticed the rush hours moved by two to three hours as travel habits changed, other cities experienced higher traffic in the middle of the day compared with the 2019 data.
Understanding Congestion Level Percentage
Congestion Level percentage signifies the extra travel time required by a driver when compared with an uncontested situation. If the congestion level indicates 50%, it implies that, on average, travel time is 50% longer than during the uncongested baseline conditions.
Similar to 2020, travel in 2021 was influenced by the consequences of the health crisis. In 2021, traffic was lower than in 2019, which can be considered the pre-COVID times’ baseline. This drop in vehicular traffic was more noticeable at rush hour. The survey found that the congestion levels dropped by an average of 19 percent.
Globally, congestion was 10% lower vs. 2019, with a decrease of 19%, particularly at peak hours. Out of the 404 cities, 283 encountered lower average congestion in 2021 than 2019. However, multiple cities exhibited extreme fluctuations in traffic throughout 2021, going from extreme lows when travel restrictions were placed to extreme highs when the restrictions were eased or lifted.
Read more: “Buy a Decade of Climate Progress”: What Biden’s $2T ‘Build Back Better’ Agenda Means for the U.S.
The Sustainability Consciousness:
ESG and Sustainability
Car manufacturers, fleet operators, and governments are stressing more about introducing Environmental, Social, and Governance (ESG) factors to present more sustainable power solutions. With the definitive breakthrough of the EV revolution, greenhouse gas (GHG) emissions can be monitored. Linking together the environmental, social, and governance factors with sustainable initiatives will help establish a positive link between ESG and financial performance for value creation.
By embracing positive change and implementing holistic norms, we can strive towards building a sustainable mobile infrastructure. This will further help reduce the congestion levels and promote alternative sustainable transport modes, improving emission levels.
Adoption of better technology that employs real-time data analytics, bold investments, and a fearless approach will help pinpoint the existing traffic congestion bottlenecks and define better congestion management solutions.
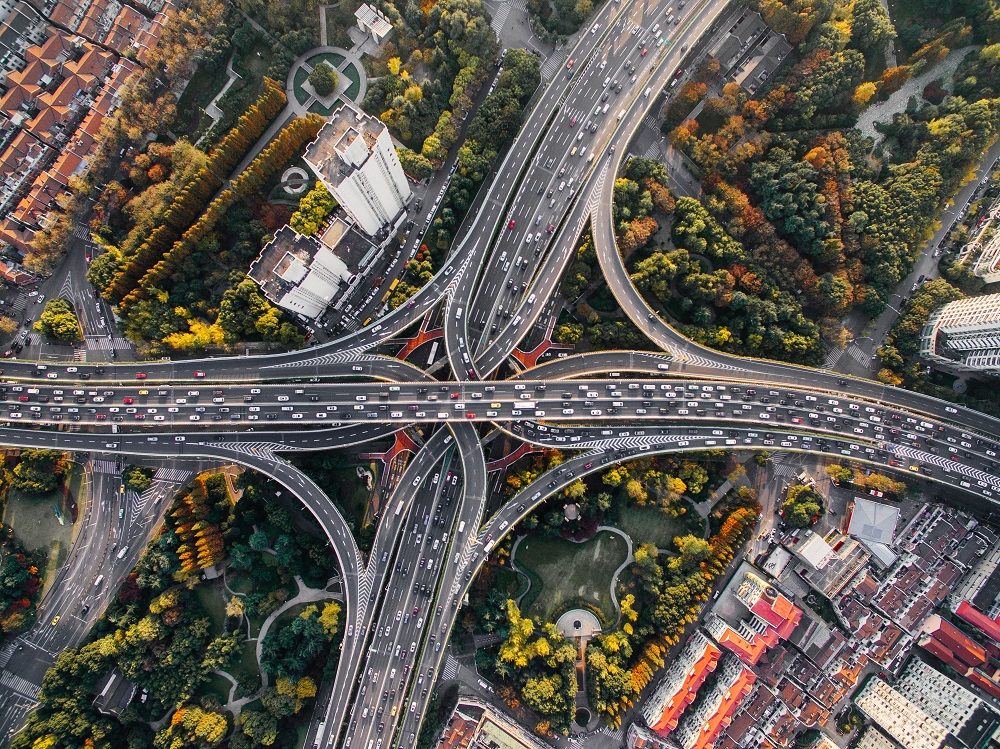
Tackling Urban Congestion
A perennial issue for cities globally, congestion is rapidly worsening. Factors like economic expansion, increased urbanization, the rise of e-commerce, and underinvestment in infrastructure have aggravated urban congestion in recent years.
The trends that aggravate congestion are showing zero signs of weakening. While most cities are not fully articulated with the steps of improvement, adopting policies and tools can help reduce congestion. But developing road infrastructures and expanding their capacity isn’t the solution. The only significant difference can be brought by changing behaviors and traffic patterns. When traffic goes beyond the threshold, congestion rises exponentially.
A proactive approach can be implemented to shift the trajectory of mobility and make cities across the world more habitable, with convenient, clean, and cost-effective solutions. Restricting drivers to drive during peak hours can lead to significant improvements, as we experienced during the pandemic.
Urban mobility contributes to congestion, climate change, health, and economic development. With a collaborative emphasis on citizen-centered mobility, we can help drive an ecosystem that will lead us to a future where we desire to live.
Renewed Habits
Another significant factor in lowering the congestion levels throughout the pandemic was the change in preference of travel by cars and public transport to active transport like walking or cycling.
The Rising Crises
2021 was the year that solidified our working habits; work from home became the new standard for companies, teleconferences replacing physical meetings, and flexible work hours allowed commuters to avoid and offset their rush hours. As a result, peak hours experienced a shift in almost 40% of the cities globally. Some cities experienced traffic spread throughout the daytime; peak traffic hours declined.
In Conclusion
Despite the brief respite from COVID-19, the traffic and congestion levels were still less in 2021 than in the pre-pandemic times. The massive fluctuations in traffic and congestion levels will continue to rise and fall due to cities going into and coming out of lockdown.
Are we getting back to normal? Or have our travel routines changed forever?
The answer is “NO.”
With our world changing and unpredictability becoming the new normal, a new light shines as we get to experience how reopening the world from COVID-19 lockdowns impacted congestion in our cities globally.
The pandemic has caused extensive heartache and economic strife worldwide, but it recalibrated how we travel. With congestion levels and traffic dropping during rush hours, we might be moving towards a brighter future for our roads.
With offices in New York, San Francisco, Austin, Seattle, London, Zurich, Pune, and Hyderabad, SG Analytics, a pioneer in Research and Analytics, offers tailor-made services to enterprises worldwide. A leader in ESG consulting, SG Analytics focuses on strengthening and delivering sustainable solutions to make responsible decisions. Contact us today if you are looking to make critical data-driven decisions that stimulate accelerated growth and breakthrough performance.